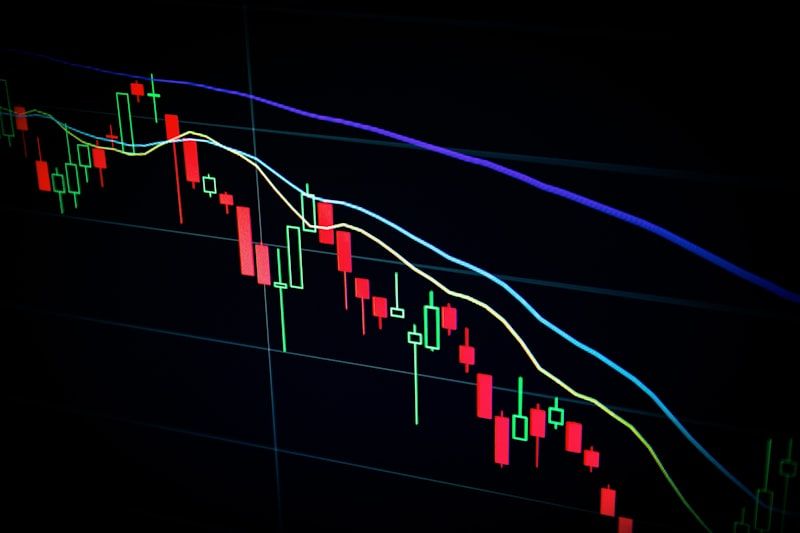
It is one of the most frustrating experiences in trading: you see a strong, aggressive trend moving rapidly in one direction, you finally muster up the courage to jump in, and the moment you click "Buy" or "Sell," the market reverses.
You didn’t lack discipline; you lacked a visual boundary. You chased an exhausted market.
In quantitative finance, we know that markets operate on a continuous spectrum of expansion and mean reversion. Trends stretch like a rubber band, but eventually, they must snap back to their average value. To trade this phenomenon successfully, you need an objective way to measure when a market is "too stretched."
Enter the Moving Average Cross Alerts indicator for NinjaTrader 8. This free, highly intuitive tool acts as a visual "stoplight" on your charts, warning you when a trend is likely exhausted and signaling high-probability counter-trend opportunities.
---
What is the Moving Average Cross Alerts Indicator?
Often referred to by professional traders as a "thing of beauty," this indicator simplifies complex mean-reversion mathematics into a straightforward, color-coded visual system.
Instead of cluttering your charts with multiple standard deviation bands, channels, or oscillators, the indicator prints a clean, large Red or Green "stoplight" dot based on how far the active price bar is from a user-defined Moving Average (MA).
Here is how the underlying logic works:
1. User-Defined Moving Average: You select your preferred MA type and period (e.g., a 20-period Exponential Moving Average).
2. User-Defined Threshold: You input a maximum distance threshold measured in ticks.
3. The "Green Light" (Within Threshold): If the current price is closer to the moving average than your set threshold, the indicator displays a Green dot. This means the market is in a healthy, balanced state.
4. The "Red Light" (Overextended): If the current price stretches farther than your threshold, the indicator prints a Red dot. This is your warning that the trend is statistically overextended and a counter-trend move back to the moving average may be imminent.
---
Why Every NinjaTrader 8 User Needs a "Stoplight" System
The greatest threat to a trader’s capital isn't a bad strategy—it's overtrading and chasing extended moves.
Just as institutional traders use standard-deviation bands or Volume Weighted Average Price (VWAP) as "stretched market" alarms, retail traders can use this indicator to build a hard boundary for their setups.
Pro Tip: Think of the Red dot not as a signal to instantly trade against a strong trend, but as a "cop on the corner." It tells you that buying or selling at the current price is mathematically unfavorable. If you want to take a counter-trend trade, the Red dot is your green light to start looking for reversal patterns.
By using this simple visual cue, you immediately achieve two critical trading goals:
* Eliminate FOMO (Fear of Missing Out): When you see a Red dot, you know the easy money in that trend has already been made. You avoid buying the exact top or selling the exact bottom.
* Identify High-Probability Mean Reversion Entries: When a market stretches too far from its moving average, the probability of a "snap-back" move increases. This indicator highlights these exact turning points in real-time.
---
How to Set Up and Trade the Indicator (Step-by-Step)
To get the most out of the Moving Average Cross Alerts indicator, you should tailor its settings to the specific asset class and volatility you are trading.
Step 1: Define Your Baseline Moving Average
For day trading index futures (like the MNQ or MES) or liquid Forex pairs, a 20-period or 50-period Exponential Moving Average (EMA) is an excellent baseline. It reacts quickly enough to catch intraday swings while remaining heavy enough to filter out random market noise.
Step 2: Calibrate Your Tick Threshold
Your tick threshold must reflect the market’s current volatility. You can calculate this by looking at the Average True Range (ATR).
* In a low-volatility environment, you might set the threshold to 40 ticks.
* In a high-volatility environment, you might expand it to 80 to 100 ticks to avoid false reversal signals.
Step 3: Choose Your Plot Orientation
The indicator allows you to customize whether the stoplight dots appear above or below the price bar. For optimal visual clarity, configure the dots to print *above* the bar during an overextended uptrend (signaling a potential short) and *below* the bar during an overextended downtrend (signaling a potential long).
---
Two Powerful Trading Strategies Using This Indicator
```
[Healthy Trend (Green Dots)] ---> [Price Stretches Beyond Threshold] ---> [Red Dot Prints (Warning)] ---> [Execute Mean Reversion Fade back to MA]
```
Strategy 1: The Mean Reversion "Fade" (Counter-Trend)
This strategy is designed to capture quick profits as price snaps back to its average.
* The Setup: Price is in a strong uptrend, and the indicator prints a Red dot above the price bar, signaling that the market is overextended by your defined tick threshold.
* The Trigger: Wait for a bearish reversal candlestick (such as a shooting star or engulfing bar) to form while the Red dot is active.
* The Target: Your primary profit target is the baseline Moving Average line itself.
Strategy 2: The Trend Continuation Filter (With-Trend)
You can also use this tool to improve your trend-following entries.
* The Setup: Establish that the market is in a strong trend (e.g., price is consistently making higher highs and higher lows).
* The Rule: Only enter pullback trades when the indicator is displaying Green dots.
* The Benefit: This ensures you are only entering the trend when price is close to value (the Moving Average), protecting you from buying at a premium.
---
Streamline Your Trading with Automation
One of the best features of NinjaTrader 8 is its robust alert system. Because this indicator relies on clear, objective mathematical rules (distance in ticks from an MA), you can easily set up NinjaTrader to send you an audio alert or a pop-up window the exact moment a Red dot appears.
Instead of staring at charts for hours on end, waiting for a market to stretch, you can let the system run in the background. When the "Stoplight" warns of an extreme extension, you'll get an alert, allowing you to step in and execute with institutional precision.
Get Your Free Copy Today
Successful trading is about making objective, repeatable decisions. By adding a clear visual boundary to your charts, you remove the emotional urge to chase runaway markets and open the door to highly profitable mean-reversion setups.
The best part? This powerful visual tool won't cost you a dime.
Elevate your NinjaTrader 8 platform today. Download the Moving Average Cross Alerts indicator for free here and start trading with the ultimate visual edge!